
CopterCurrents
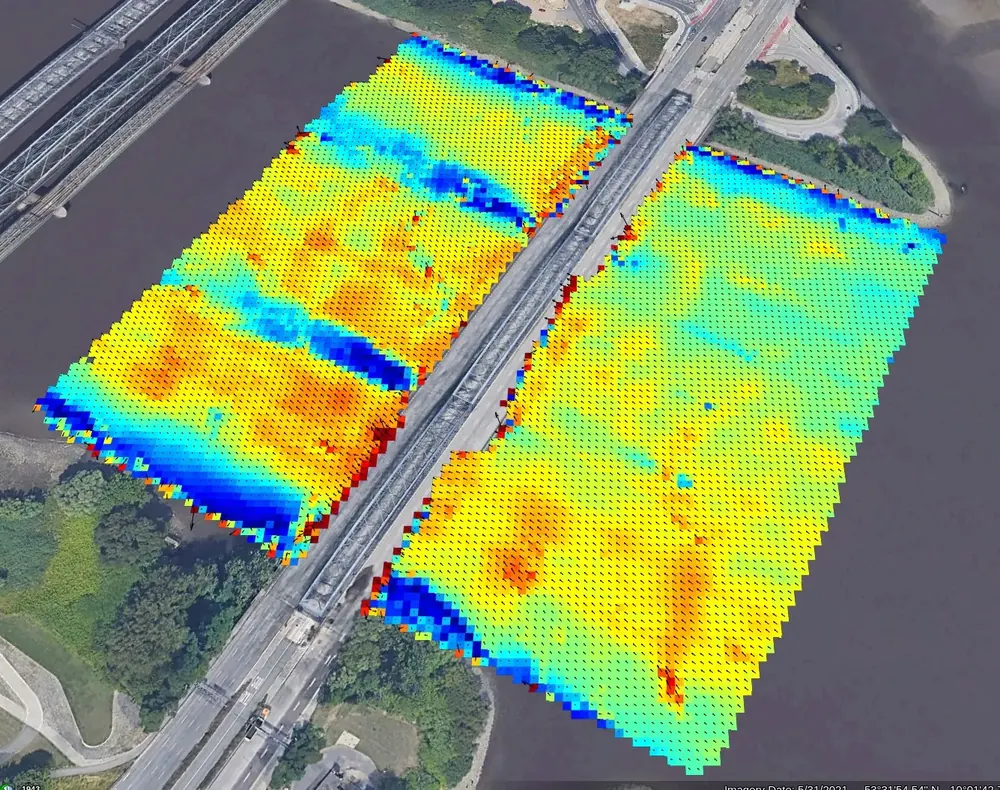
Ocean Currents - Service - 10 m to 1 km
We measure the surface current of rivers and estuaries with drones and deliver a georeferenced report.
Imagery: Google Earth
Overview
A drone films the water surface from above. From the video we derive a current map every minute. Fixed installations on a bridge, mast, or building are also possible.
The method needs wind waves on the water surface. Rivers and estuaries are suitable. Small streams are not.
What you get
A georeferenced report with current maps, gridded data, and on request discharge. We document the conditions, processing parameters, and quality control.
How it works on site
We plan the flights and obtain the permits. Flying over federal waterways and nature reserves needs the explicit consent of the responsible authority (LuftVO section 21h).
What to be aware of
Without wind waves there is no measurement. Stresser et al. (2017) validated the method under overcast sky and low wind (about 1.5 m/s). Stronger wind adds surface drift, which the method measures as part of the current.
What does the method measure?
ω = √(g |k| tanh(|k| d)) + k · U
Surface waves follow the linear dispersion relation: a wave with wavenumber vector k has a frequency ω, set by gravity g and water depth d. A current U shifts this frequency. We fit the dispersion relation to the 3D wavenumber-frequency spectrum of the video and obtain U.
- Near-surface current - short waves (0.1 to 1 m) sense the current down to a penetration depth of order 1/(2k), the upper decimetres of the water column
- Wind and waves - wind-induced surface drift and Stokes drift are part of the measured current
- Water depth - for these short waves and depths above 1.5 m, tanh(kd) > 0.984, so depth has little influence. Depth estimation is experimental
Specifications
| Parameter | Value |
|---|---|
| Measured quantity | Near-surface current vector, upper decimetres |
| Time interval | 1 current map per minute |
| Grid spacing | 4 m (8 x 8 m windows, 50 % overlap) |
| Velocity range and step | -2 to 2 m/s per component, 0.01 m/s step |
| Quality control | Estimates with signal-to-noise ratio below 3 are masked |
| Validation against ADCP | RMSE 0.09 m/s, bias 0.00 m/s, correlation 0.97 |
| Validation flight | 204 m altitude, footprint 322 x 189 m, pixel 8.3 x 8.2 cm |
| Camera | 3840 x 2160 pixel, 25 Hz, nadir, gimbal-stabilised |
| Coordinates | UTM |
| Water depth | experimental |
Processing parameters and validation are from Stresser et al. (2017), Elbe at Lauenburg.
The permitted flight altitude, the camera resolution, and the wavelength of the wind waves limit footprint and resolution. The analysis windows must be large enough to contain the imaged waves.
What you will get
- Report as PDF with method, processing parameters, conditions, and results
- Current maps and gridded data with quality flags, in UTM coordinates
- Data as shapefile and on request in other formats
- Archived raw video
Use Cases
- Construction planning - currents exert forces on structures
- Environmental assessment - currents transport sediments, nutrients, pollutants, and heat
- Hydrographic surveys - current maps next to vertical ADCP profiles
- Areas without vessel access - the drone measures from the air
FAQ
How does it compare with an ADCP?
In the validation on the Elbe, the drone-based currents agreed with a boat-mounted ADCP with an RMSE of 0.09 m/s and no bias. The two do not measure the same thing. The drone sees the upper decimetres. The ADCP measured from 0.72 to 2 m below the surface, about 30 minutes later.
Can you derive discharge?
Yes, on request. With a cross-section survey and the water level we compute discharge from the surface current following the Manual on Stream Gauging (WMO-No. 1044).
Can you measure water depth?
Water depth enters the dispersion relation, but the short waves used for the current hardly depend on it. Depth estimation is experimental. We do not include it in the standard report.
Background
Helmholtz-Zentrum Hereon developed the method and first demonstrated it on the Elbe:
- Stresser, M., Carrasco, R. and Horstmann, J. (2017) Video-based estimation of surface currents using a low-cost quadcopter. IEEE Geoscience and Remote Sensing Letters, 14(11), pp. 2027-2031. doi:10.1109/LGRS.2017.2749120 (manuscript)
- World Meteorological Organization (2010) Manual on Stream Gauging, Volume I - Fieldwork. WMO-No. 1044. WMO Library
Request a Quote
Contact us with location, river width, and the period you want to measure.